Hello @Piotr.Klimaszew
Welcome to the StereoLabs community
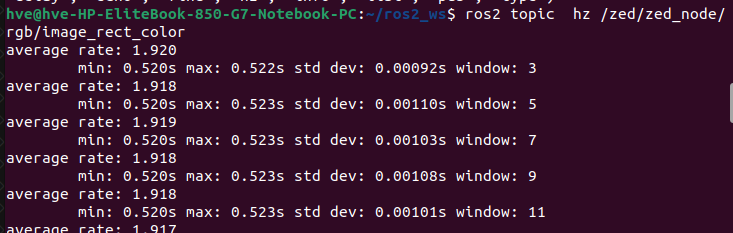
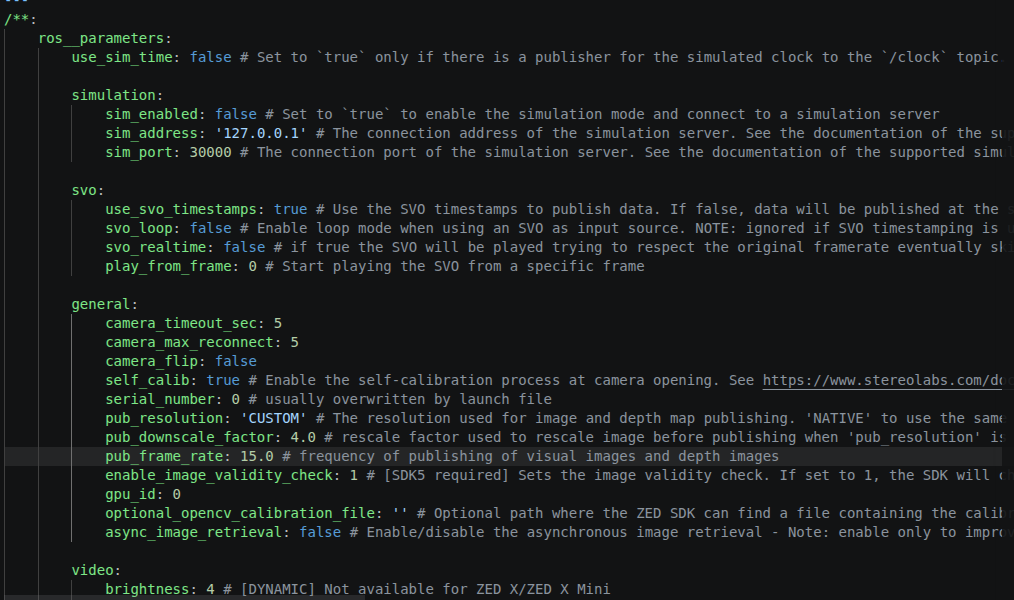
The publisher is publishing close to the set up frequency (15Hz) but I have around 2Hz on the subscriber using ros topic hz command.
With a 4x downscale factor the raw frame drops to roughly 480 x 270 x 4 = ~520 KB, so at 15 Hz you are only pushing ~60 Mbit/s. That fits comfortably on a Gigabit link, so this is not a bandwidth problem. The bottleneck is somewhere in the DDS transport / QoS path, not the cable.
A few things to check, in order:
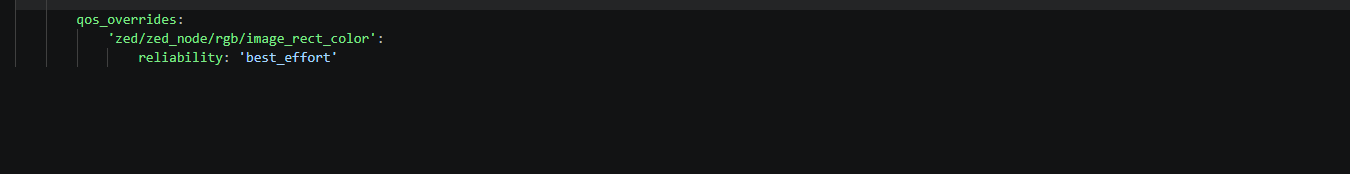
1. QoS reliability mismatch on the subscriber.
The image topics are published with a SENSOR_DATA profile (BEST_EFFORT, volatile). If ros2 topic hz or your subscriber requests RELIABLE, the middleware has to retransmit, which stalls dramatically over a real network and produces exactly this kind of “publisher fast, subscriber slow” behavior. Verify with:
ros2 topic hz /zed/zed_node/rgb/image_rect_color --qos-reliability best_effort
If the rate jumps to ~15 Hz, the issue was a QoS mismatch in your own subscriber and you simply need to set it to BEST_EFFORT.
2. Confirm the rate on the Jetson side first.
Run ros2 topic hz for the same topic locally on the Orin. If it reads 15 Hz locally but ~2 Hz on the laptop, the loss is purely in the cross-host DDS path. If it is already low locally, the problem is upstream (grab loop / publishing) and the network is innocent.
3. CycloneDDS fragment handling.
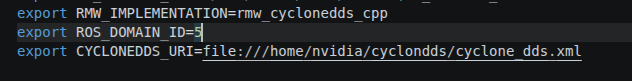
Even a downscaled image still exceeds one UDP datagram, so it is fragmented. Over a direct Ethernet link the default CycloneDDS socket buffers are often too small and dropped fragments mean the whole sample is discarded, which collapses the effective rate. Make sure your CycloneDDS XML actually applies (check CYCLONEDDS_URI is exported in the same shell that launches the node) and raise the receive buffer, for example:
xml
<CycloneDDS>
  <Domain>
    <Internal>
      <MinimumSocketReceiveBufferSize>10MB</MinimumSocketReceiveBufferSize>
    </Internal>
  </Domain>
</CycloneDDS>
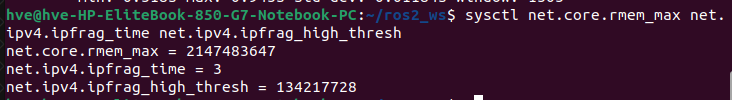
You also need the matching kernel limit:
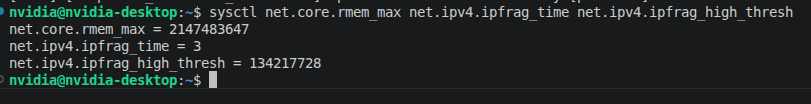
sudo sysctl -w net.core.rmem_max=10485760
4. Rule out the measurement.
ros2 topic hz itself spins up a subscriber, so if it inherits a RELIABLE default or runs single-threaded under load, it can under-report. Cross-check with ros2 topic bw on the same topic to see whether bytes are flowing steadily.
My strong suspicion is point 1, a BEST_EFFORT vs RELIABLE mismatch; that is the most common cause of this exact symptom and is independent of how much you downscale.
Network tuning and the full QoS documentation for the wrapper are here:
Let me know the local-vs-remote ros2 topic hz readings and whether forcing best_effort changes things; that will tell us immediately which path to follow.