I attached a screenshot with a table showing numeric error values (see image). I have a specific question about interpretation.
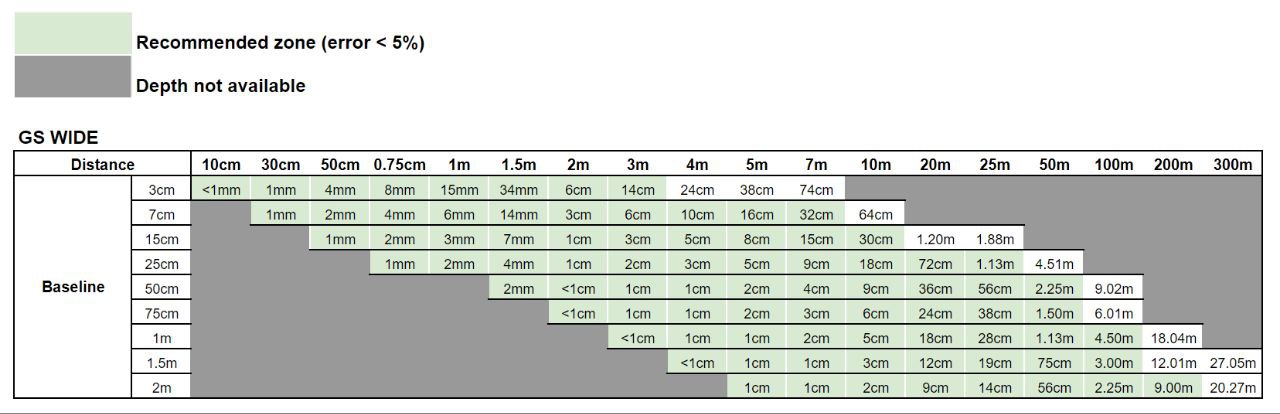
For example, one cell shows “2 cm” at 7 m for a baseline = 1 m. Could you please clarify precisely what this means?
Specifically:
Is “2 cm” an RMS (root mean square) error, standard deviation (σ), mean absolute error, maximum error, or a confidence interval (e.g. 95% CI)?
Under which conditions was this measured (scene texture, lighting, target type, number of samples, distance distribution)? Are these laboratory measurements or typical field results?
Thank you for your reply. I understand now that the values in the table are theoretical, algorithm-based estimates of expected accuracy at different ranges.
However, I still need information about the error metric itself:
What “expected accuracy” means?
Does the value (for example, 2 cm at 7 m with 1 m baseline) represent standard deviation (σ) of depth error, RMS error (RMSE), a confidence interval (e.g. 95%), or some other definition?
In other words: should I interpret 2 cm as a typical spread around the mean (σ), or as an expected bound (+/-2 cm within 95% of cases), or as RMS error including bias?
This detail is important for system design. Could you please clarify what exact statistical meaning is behind the reported numbers?
Consider, for example, a baseline of 1 m, at 5 m, the theoretical accuracy is 2 cm.
This means that you can expect depth measures in the range 5 +/- 0.02 m.
Please always keep in mind that these are theoretical values that require optimal light and texturization conditions.