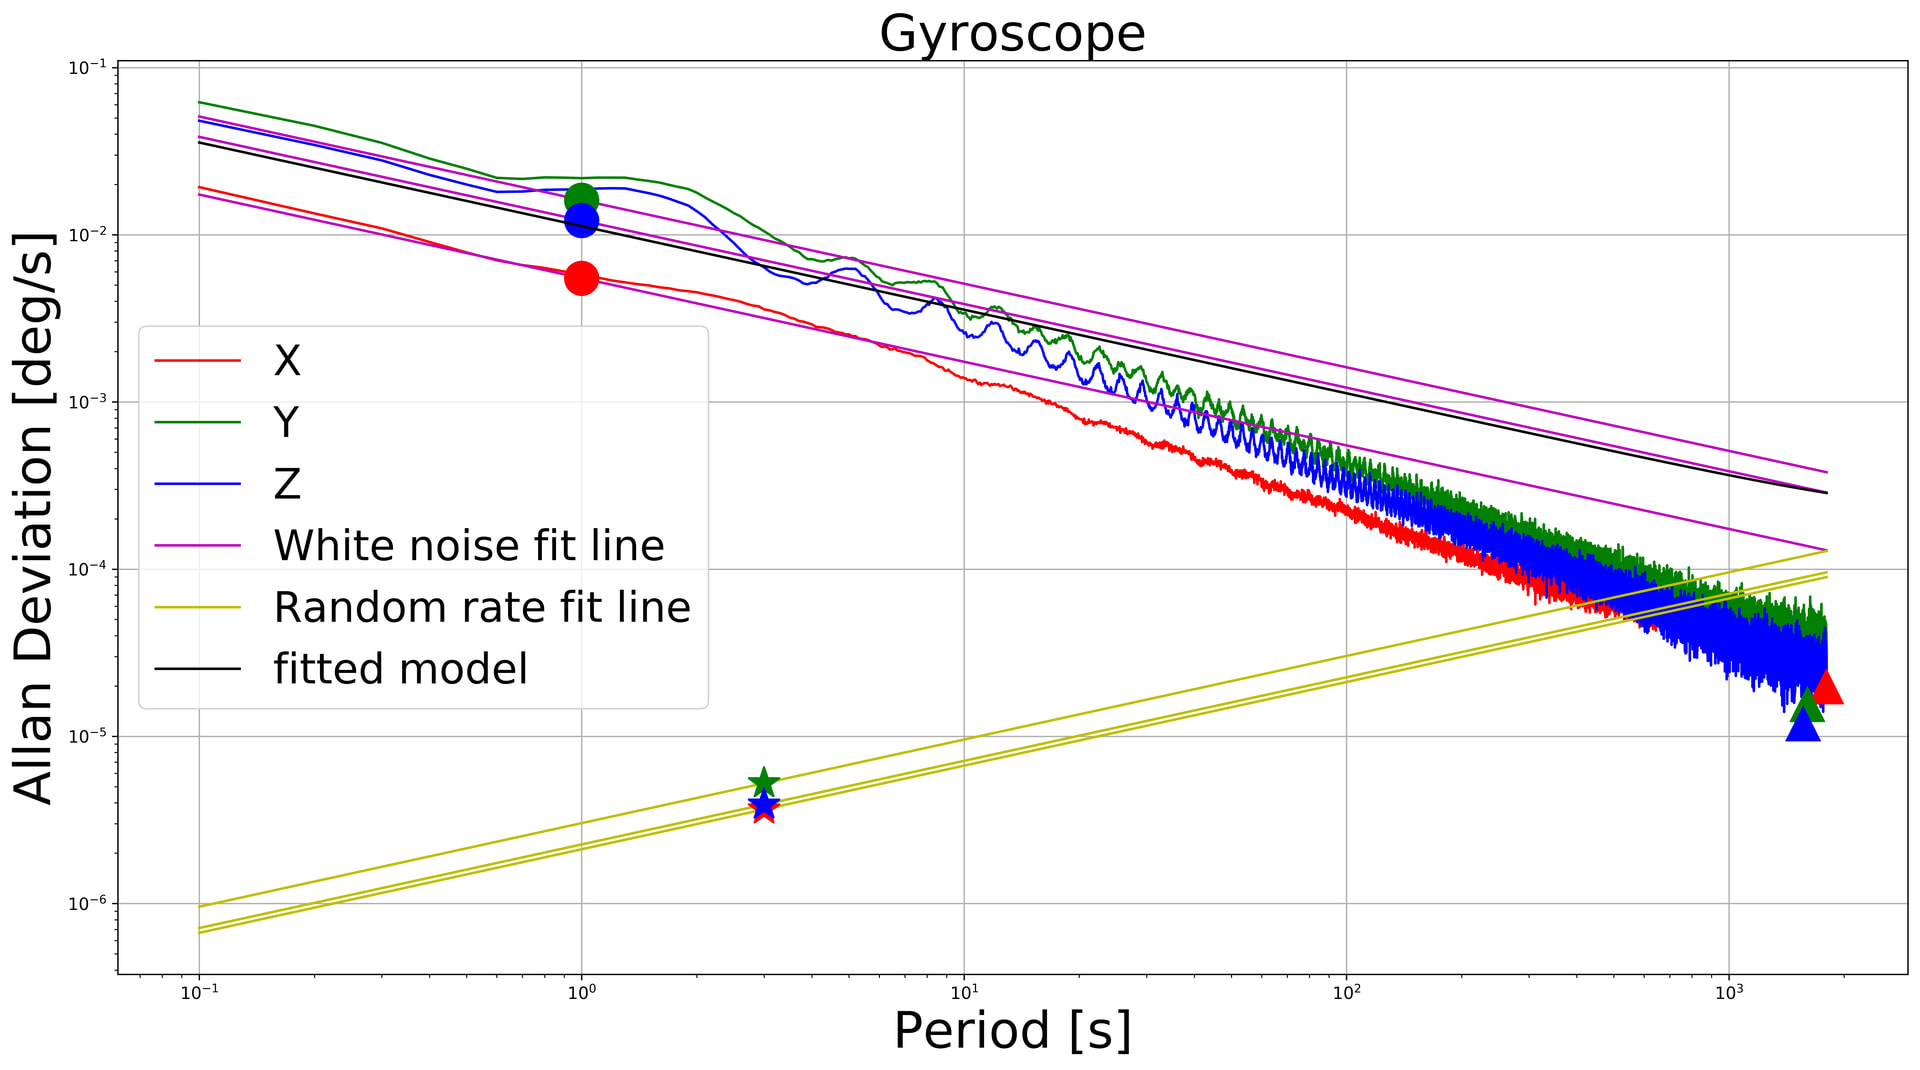
I did an Allan-Variance analysis on my ZED X internal raw IMU stream. I recorded IMU measurements via ROS2 for 11.5 hours with a sampling and publising rate of 200Hz. I used the allan_variance_ros tool and followed all their steps. However, my gyroscope allan⁻variance plot shows a very weird behavior:
The imu/data_raw topic published by the ZED ROS 2 Wrapper is “raw” only in the sense that it is not orientation-filtered. Its angular velocity is the ZED SDK angular_velocity field, which is already corrected for bias, scale, and misalignment, and the gyroscope bias is estimated continuously at runtime. That online bias compensation removes the low-frequency content of the signal, so the bias instability and rate random walk regions flatten out in the Allan deviation plot. This explains the very low random walk value you obtained.
To characterize the sensor itself, record the angular_velocity_uncalibrated and linear_acceleration_uncalibrated fields directly with the ZED SDK API (IMUData reference). Call getSensorsData with TIME_REFERENCE::CURRENT in a dedicated loop, and discard duplicate samples by checking the IMU timestamp. Then run allan_variance_ros on that dataset as you did before. Keep the camera still and at a stable temperature for the whole recording.
You can find more information about the ZED X on the StereoLabs website.