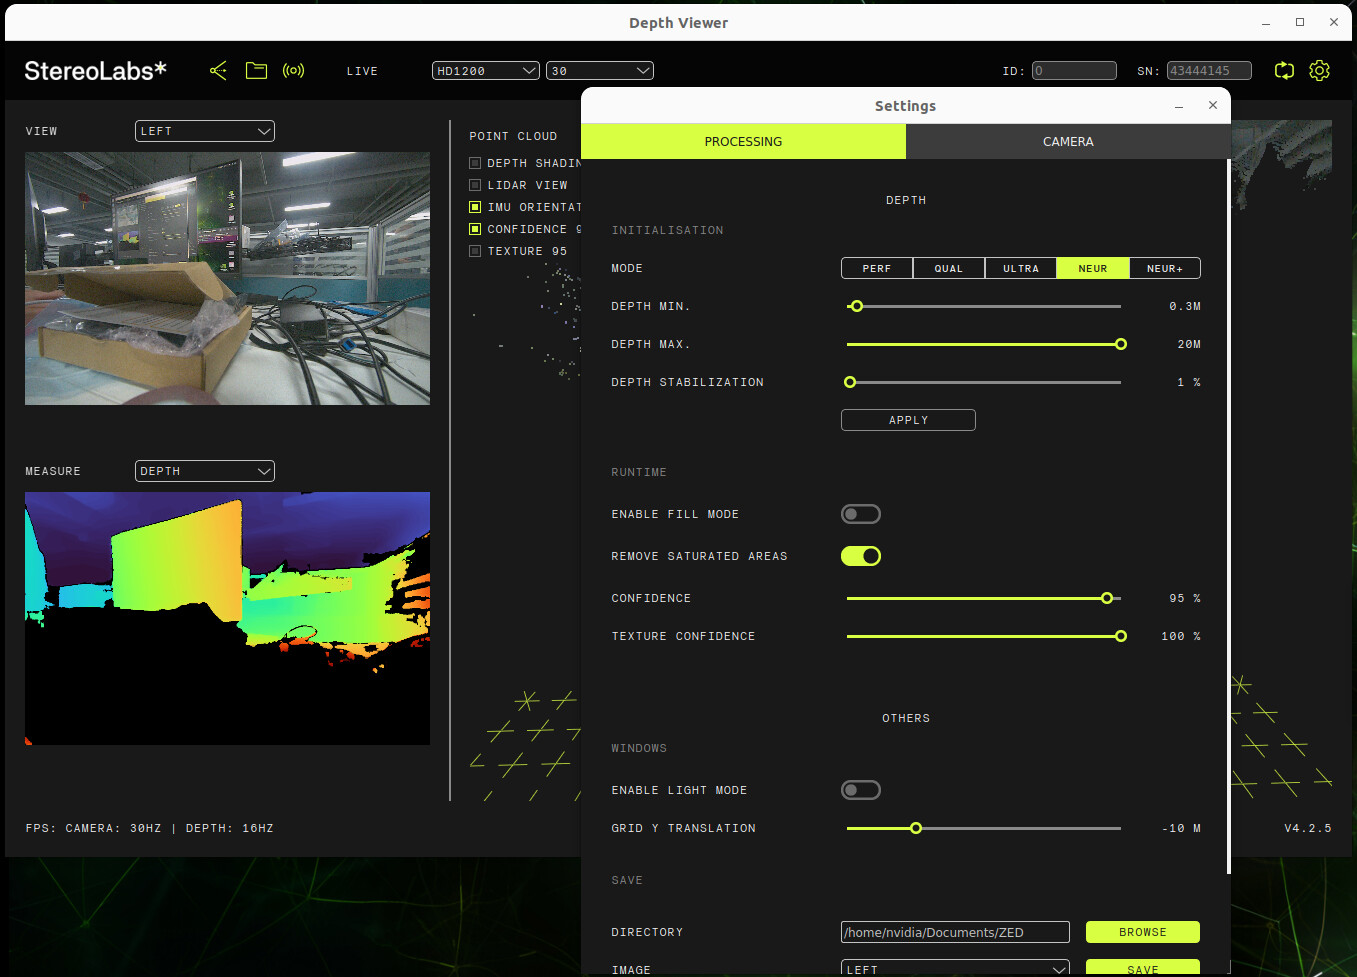
Using the ZED_Depth_viewer to activate the ZED-X camera, it was found that the system resource usage is relatively high.
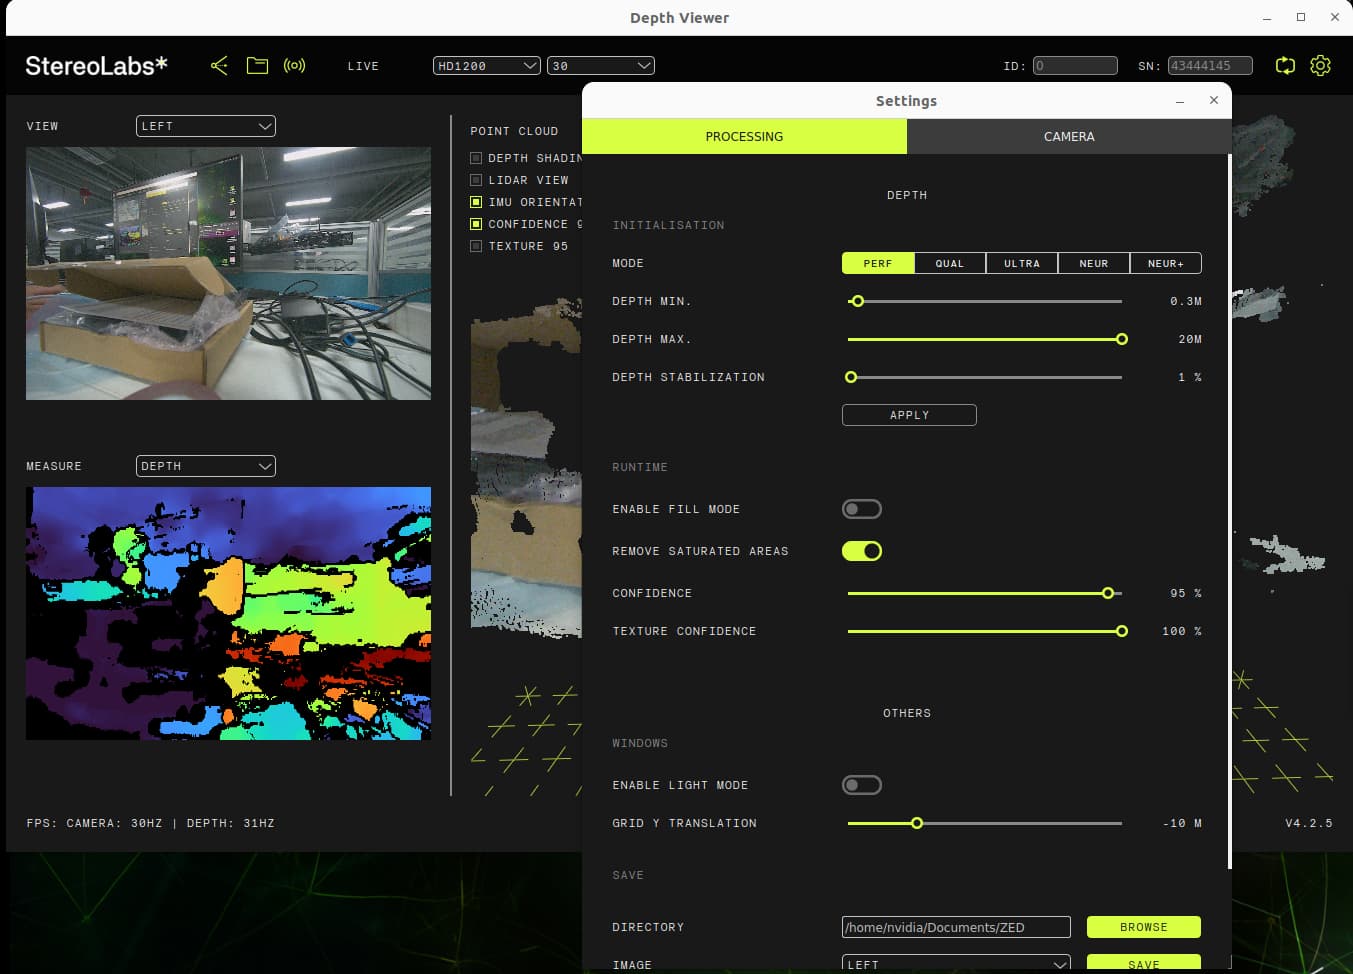
Is the NEURAL mode the only one that uses an AI depth model? Are the remaining ULTRA, QUALITY, and PERFORMANCE modes using non-model algorithms? It seems that the NEURAL mode provides better results but occupies more GPU resources, whereas the other three modes do not perform as well.
With only one ZED-X connected, the system resources are already highly occupied, leaving insufficient computational power for our algorithms. Is this level of system resource usage normal for the ZED-X? Are there any optimization schemes available?
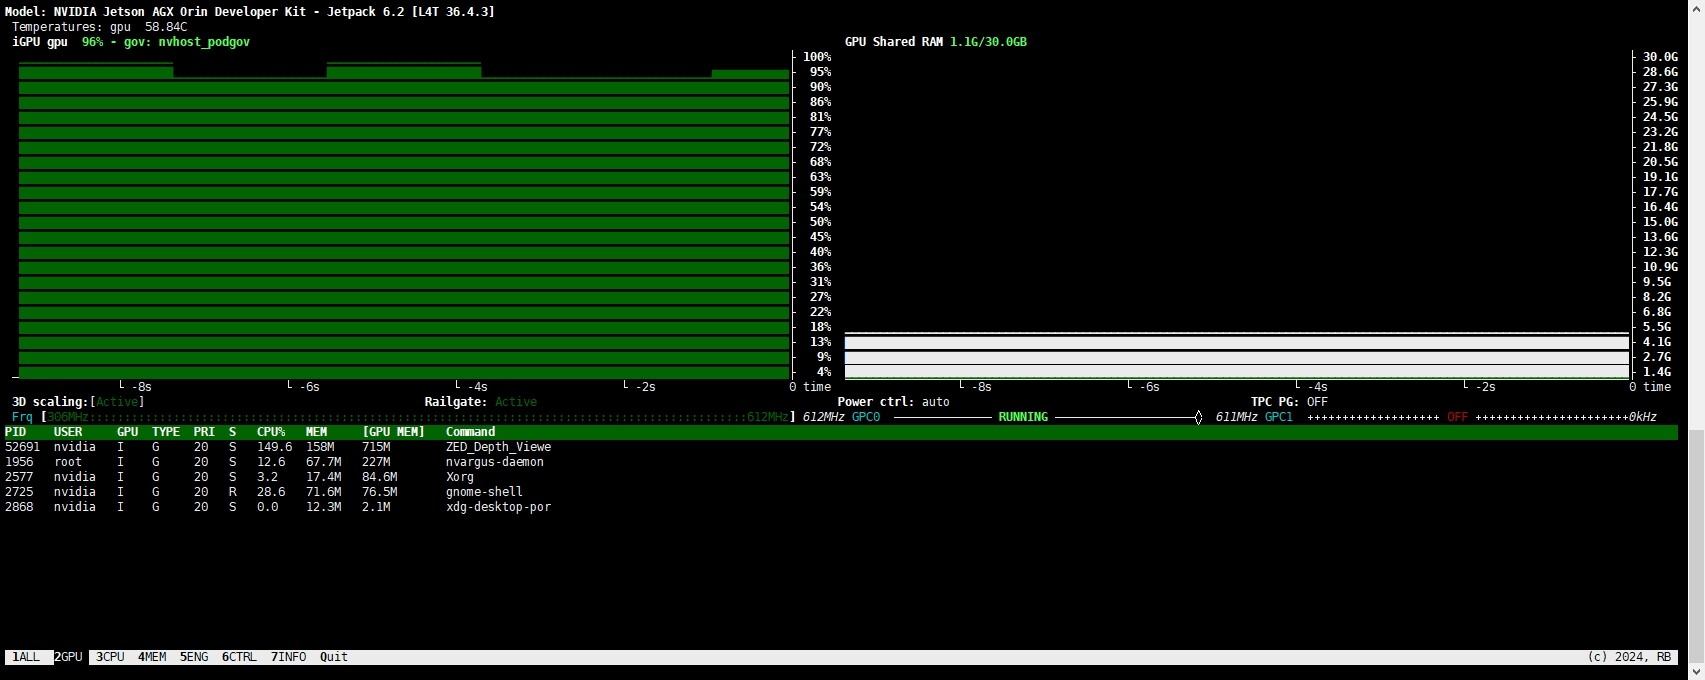
HD1200 30FPS mode, and with Depth NEURAL mode, The GPU usage reaches 95%
Hello DanielWang,
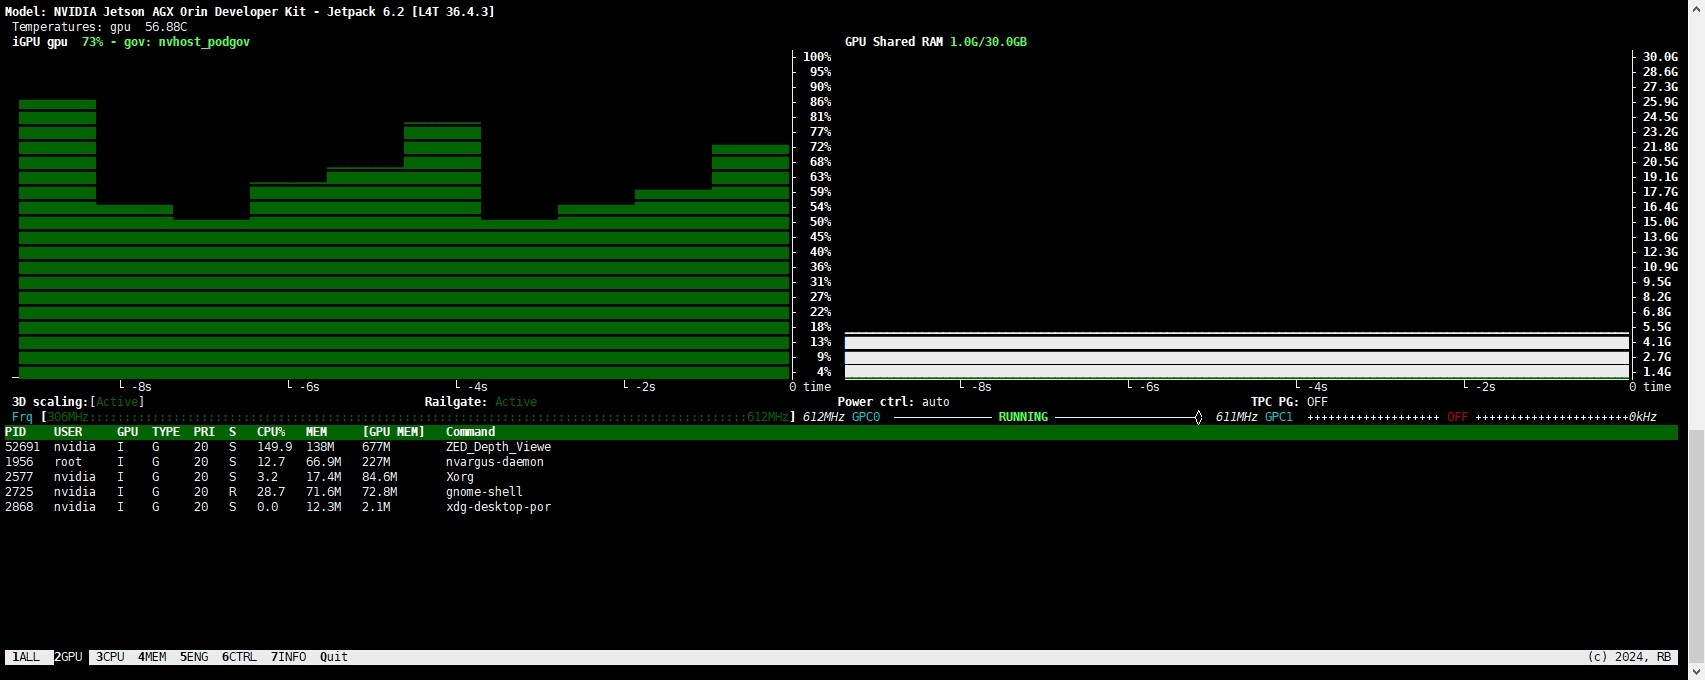
You are totally right, ULTRA, QUALITY, and PERFORMANCE modes do not use AI while Neural does. That is why you observe these performances.
We are working on release 5.0.0 for SDK which should be published soon. In this new version, the performances of the depth will be greater than it is currently. Please update your SDK as soon as it is published.
Hi hbeaumont,
I am looking forward to the release of the new version. However, I would like to confirm whether the resource consumption I am currently observing during testing is the actual resource usage of the ZED-X, or if there is an issue with my testing method?
Hello DanielWang,
It seems normal to observe these performances on a Jetson AGX Orin 32G. I do not think there is an issue with your testing method. You should just update your SDK version as soon as it is published to reduce the resource usage during your tests.
When is the new version expected to be released?
I saw that you have connected four ZED-X units to the same AGX Orin. If one ZED-X consumes so much resources, how can four ZED-X units operate normally? I am not quite sure how this setup would work. Our current project is evaluating the use of four ZED-X units, but if they consume such a large amount of resources, there won’t be much computing power left for our algorithms. Could you please help clarify my concerns? Thank you.
The new version of the SDK has reduced GPU usage by 300%. Can you provide a testing validation method? When I check with Jtop, the GPU usage is still quite high. How do you measure it?