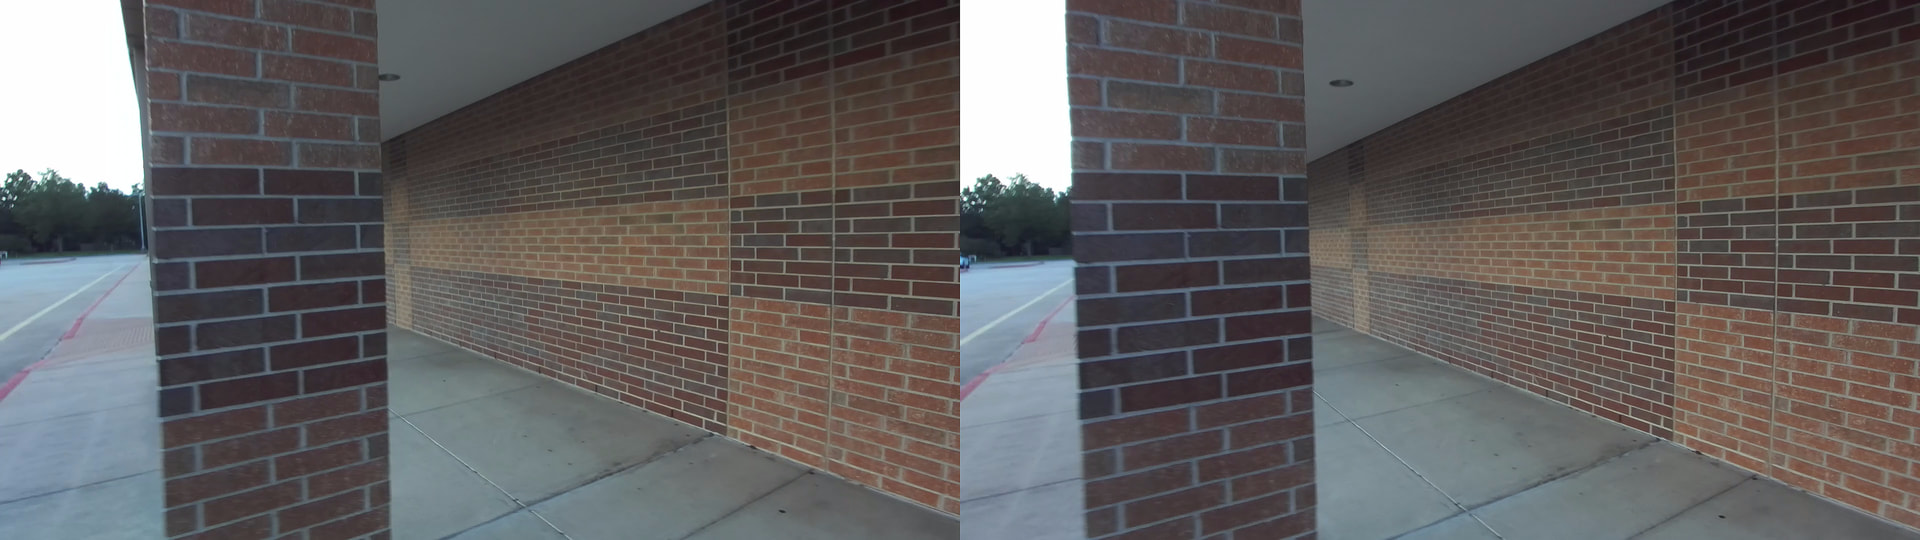
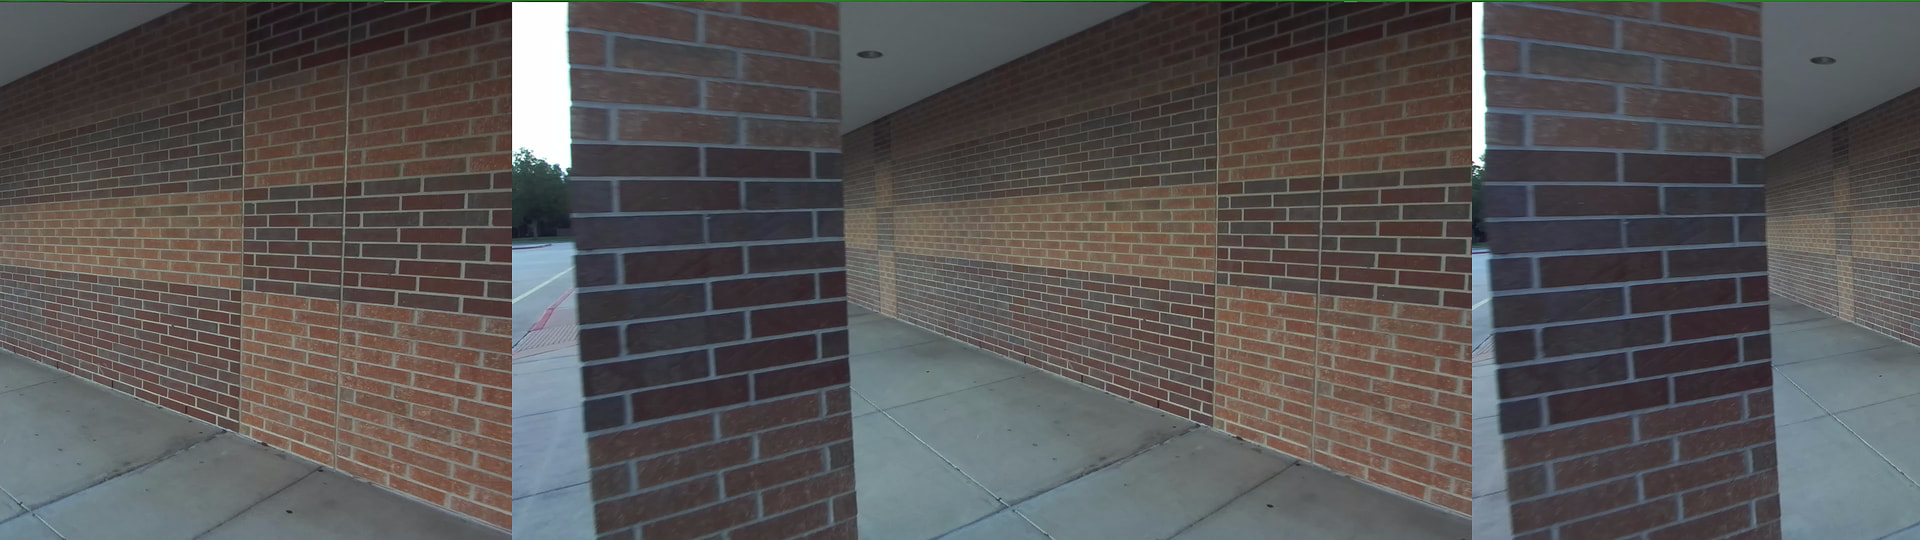
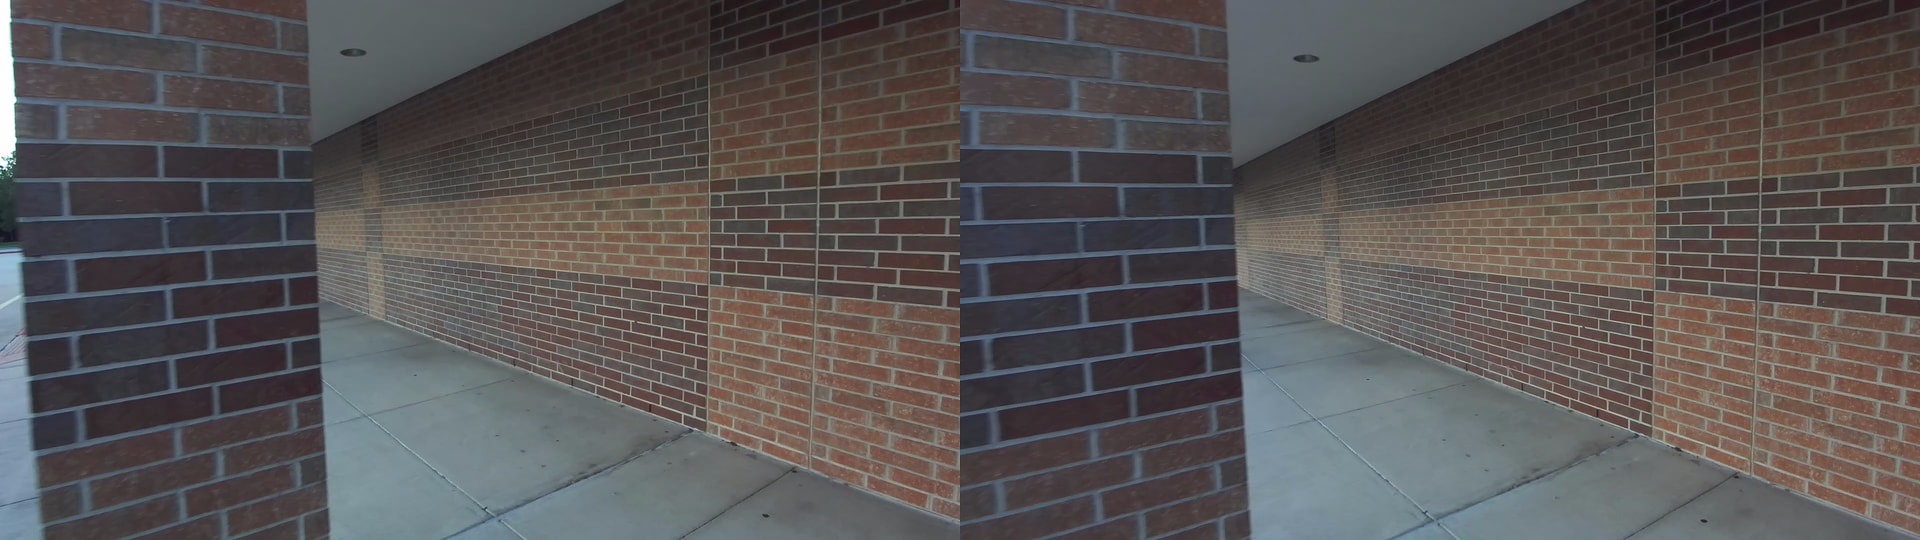
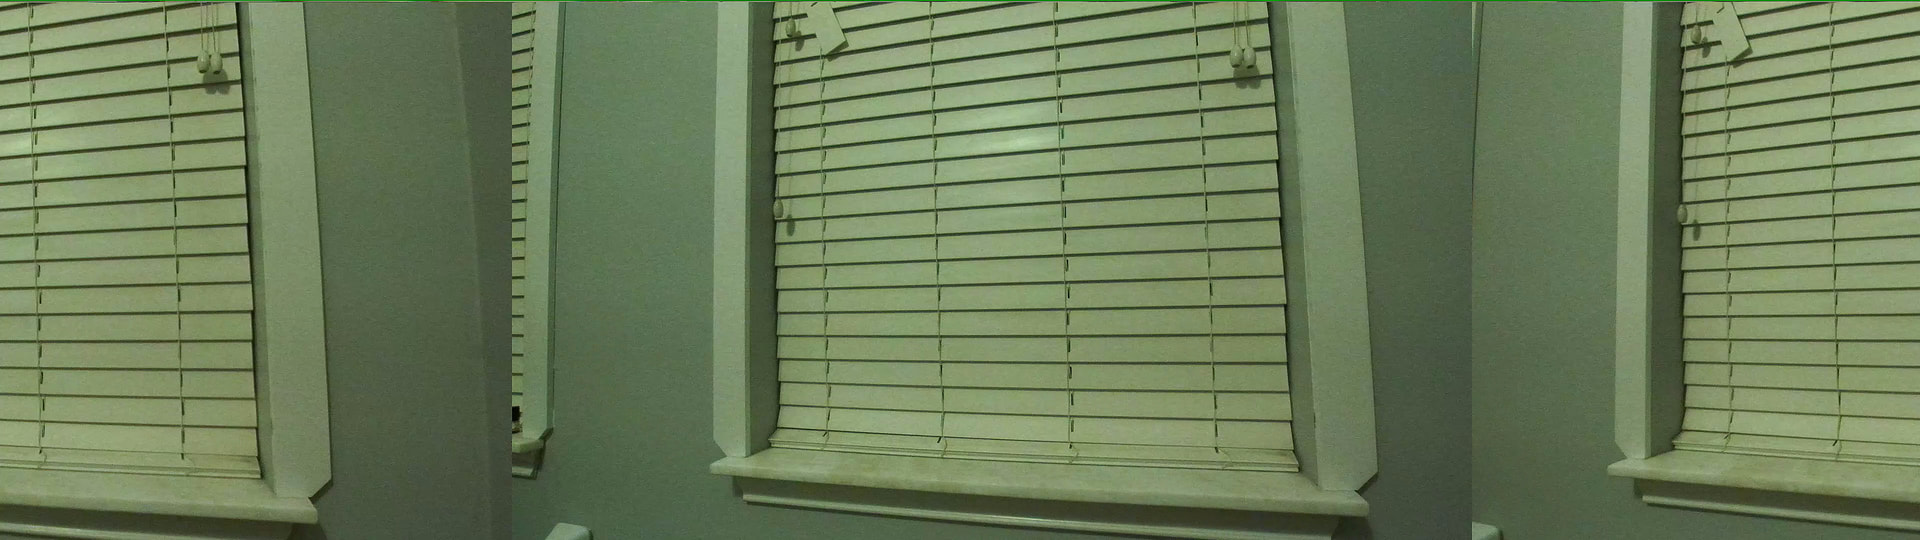
I was having some issues with spatial mapping where it seemed like for whatever reason the tracking would simply just believe that the yaw is now 40 degrees different than the previous frame and it was producing several disconnected regions in the mesh which should have been continuous. I was watching through the SVO recording and noticed something very strange in a very small number of frames.
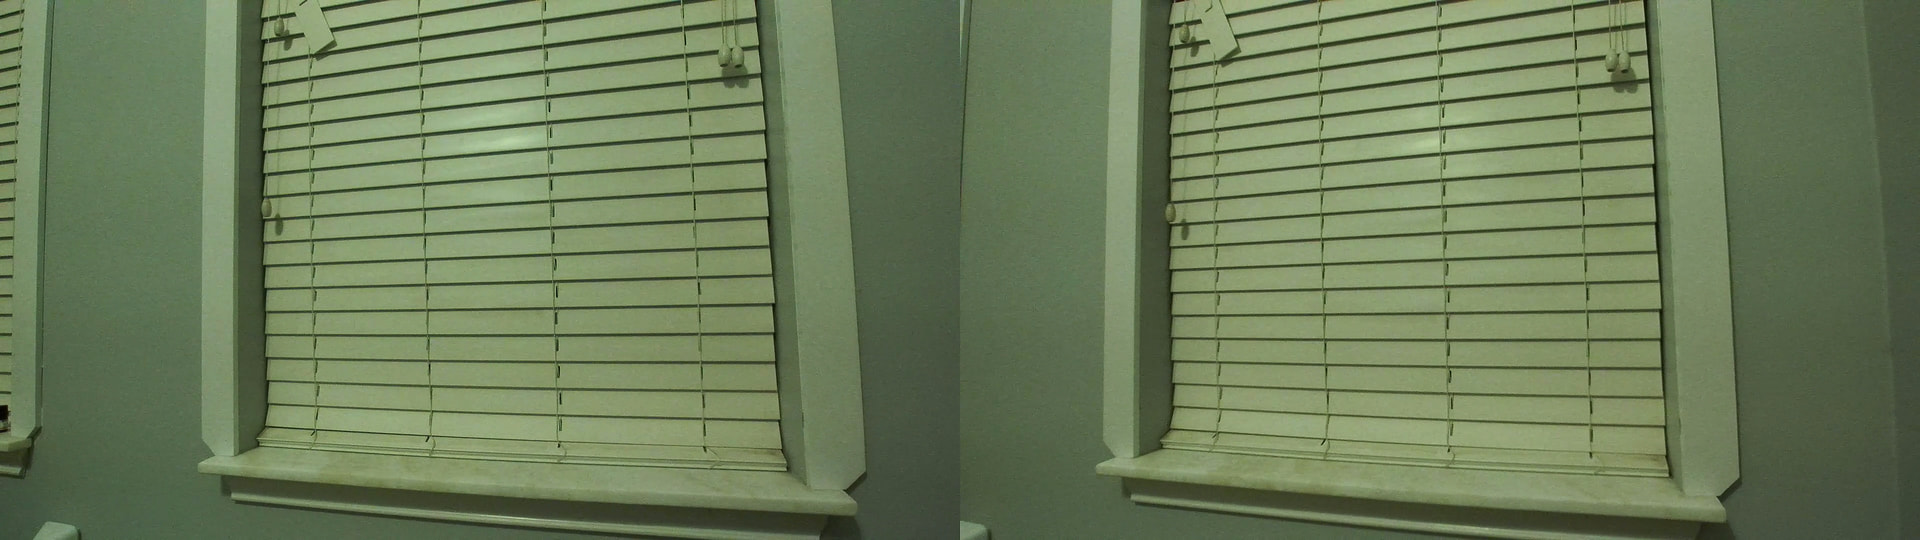
Usually when you watch an SVO in one of the playback tools, each frame is displayed side by side. But very rarely I see frames in my svo recordings where instead of each frame being side by side, it looks like one frame is in the middle and there are partial frames on either side. I attached some images below which are the frame before, the frame which has the issue, and the frame after. I can also send an SVO file if that is more helpful.
I’ve been attempting to include RTK data into the recordings recently so I thought it might have something to do with me not setting up the threading properly in my code and maybe a write operation was getting stepped on. But I recorded a regular svo using zed explorer and the issue is even occurring from those recordings as well. For reference, these recordings are 1080p@30 with H264 compression. This is on a windows 11 laptop with an RTX4070 with up to date drivers and SDK version 5.2.3. I ran the diagnostic tool thinking that maybe it could be bandwidth related but everything passed.
I would greatly appreciate any help on this because I’m completely out of ideas.
This one was recorded with the code that embeds the gnss json into the svo file.
Hi @sothos
This kind of frame tearing happens when the CPU is overloaded, and the buffer of the USB3 controller is not pulled quickly enough.
I recommend you verify that the Laptop is running in performance mode when recording SVO files.
Are you performing other operations while recording?
Is the disk fast?
I’ve tried quite a few troubleshooting and configuration changes so I’ll just list them here. Perhaps there is something I’m missing which stands out that you’ve seen as an issue before.
I did make sure that the power setting/profile was set to performance when recording. This machine has integrated graphics alongside the 4070 and I tried both the hybrid and discrete GPU only mode. I made sure to disable USB selective suspend in the power plan. All of those changes seemed to make no perceivable difference.
I also tried using a thunderbolt cable instead of the Stereolabs USB cable and this may have lowered the frequency of the issue slightly, although not eliminated, but the difference is so minor that it could also just be within margin of error. My thinking is that the thunderbolt port might provide a more direct pathway to the CPU instead of going through a separate (internal on the motherboard, not a hub) USB controller, since it’s a 13th gen intel processor and I believe intel moved the thunderbolt controller directly onto the CPU after the 11th gen series.
I updated from SDK version 5.2.3 to 5.4.0 but this didn’t seem to make much difference during recording. However, interestingly when I run the Zed Diagnostic tool when on SDK version 5.4.0 I am seeing warnings sometimes about USB bandwidth. This is with the camera plugged into the thunderbolt port with a thunderbolt rated USB C cable. The port and the cable are both rated for 5000MB/s (40Gbps) which far exceeds the 300MB/s figure I see mentioned for how much data the Zed2i can transfer.
Apart from Zed Explorer, nothing else is running on the machine during recording apart from the usual windows processes. The drive is a samsung NVMe SSD so it’s reasonably quick. It’s also only 40% full so it shouldn’t be running into any of the slowdowns associated with a nearly full disk.
As I was reading through the API reference, I did come across the sensors_required setting in InitParameters: InitParameters Class Reference | Python API Reference | Stereolabs . I don’t fully understand the process of how the host communicates with the camera and IMU and if they are separate, so please correct me if I’m wrong. It sounds like when sensors_required is set to False, which it defaults to, the host can open the IMU as a separate device on a USB2.0 connection before opening the camera. I know that with some machines, if they have multiple devices plugged into the same USB controller and one of the devices is using USB2.0, then it will force all devices on that controller down to USB2.0. Unfortunately Lenovo doesn’t provide detailed enough documentation about the controller to be able to tell whether this applies to my laptop. In the InitParameters documentation it mentions that this setting might be needed for optical USB cables, but do you recall if you’ve ever heard of anybody else requiring this setting for a situation like this?
It seems to me that there must be some setting or configuration option that I missed. The thunderbolt port and cable are rated for over 10x the transfer rate required, but somehow it’s still running into USB bandwidth issues. Do you all have any specific suggestions or tools that I could use to try and narrow down the cause of the issue during recording?
The fact that you use a Thunderbolt port instead of a USB 3.2 Gen. 1 port does not make a difference because the camera can only work in SuperSpeed mode, and the USB 3 controller will switch to 5 Gbit/s mode for compatibility.
When you plug the cable into the USB 3 port, the controller always enumerates two devices:
ZED 2i and ZED 2i HID.
The first is the video module, which communicates over the USB 3 channels.
The second is the sensors module, which communicates over the USB 2 channels made available by the USB 3 protocol.
What you write concerning some fiber optics adapters concerns the fact that some of them do no make the USB 2 channel available, then the ZED 2i cannot send inertial information, and some of the modules of the ZED SDK cannot completely work.
The ZED SDK, to be sure that everything can work, tries to retrieve HID data when opening the camera. If the HID module is not found, an error is raised. You can ignore this error by setting sensors_required to false.
No, you have not missed anything. There are no wrong settings that can cause the behavior that you described.
As I said before, they are normally caused by a system overload or, in some cases, by communication problems.
We could explore this second possibility:
What’s the length of the cables that you used?
Are the screws of the ZED 2i connector strongly strengthened?
I was able to get it working but I have no idea what fixed it. I’m still getting some occasional dropped frames, but I have not seen the frame tearing reappear like it was before so hopefully that issue is solved. The diagnostic tool also doesn’t show the USB bandwidth warning anymore.
I tried uninstalling everything to do with stereolabs or nvidia and then reinstalling drivers, cuda, the stereolabs sdk, and lastly the python library. None of that seemed to make any difference. I put my laptop away and worked on something else for several days, and then when I turned my laptop on again a few days later and plugged the camera back in all of a sudden it seems to be working as intended without actually changing anything. The only thing I can think of is that maybe the lenovo utility installed updated chipset or USB controller drivers behind the scenes. I wish I had a more satisfying solution but at this point I’m just glad it works.
Is it considered normal to encounter dropped frames when lighting conditions change? I’ve read a few threads about the auto exposure causing some slowdowns due to the communication with the camera or ISP which can lead to dropped frames. I’ve also read through quite a few of the SDK version release notes and have seen several mentions of things like auto exposure and I2C overhead, so I’m not sure to what extent the issue has been mitigated and if what I’m experiencing is to be expected. I’m not seeing massive batches of dropped frames, but when I point the camera from a shaded to sunny view it will usually drop somewhere between 5-10 frames when using 720p@60. Would that be within the realm of normal operation?
Additionally, is this dropped frames with auto exposure issue something that affects the ZED X as well? I know the ZED X eliminates many of the USB related issues, but I’m not sure if the auto exposure issue is caused by USB communication overhead or rather just a limitation of the ISP being slow to receive and respond to the exposure commands.
Just wanted to say many thanks for your help in troubleshooting this issue. I’m making the transition from Luxonis and while the ZED SDK does provide better functionality for my application, I just don’t have the years of experience working with ZED cameras to know the intricacies of the platform and be able to diagnose issues on my own.
This is possible. Optimized USB communication is important to handle the high bandwidth required by our cameras.
This is something that normally does not affect USB cameras because they have an onboard ISP.
Again, this is not affecting USB, but GMSL2 cameras.
Can you verify if you enabled the health check? This could cause slowing down:
As said above, the USB3 cameras have an onboard ISP, so the processing does not affect the host CPU/GPU load.
On the other side, the ZED X cameras do not have onboard ISPs; the image tuning processing runs on the host CPU/GPU, and this can affect the overall performance.
It’s always a pleasure to help our customers get the best possible experience with our products.
I’ve only been using ZEDExplorer to record SVO files since I wanted to eliminate my code being the problem. I don’t see a slider or option for enable image validity check in ZEDExplorer so I’m not sure if that is used by default in explorer or not. I did notice that image enhancement is turned on by default and that is the way that I’ve been recording SVO files.
Could this possibly be something to do with the SVO compression? I’m using H264 when recording. It’s been many years since I had a class on compression so I’m a bit out of practice. Is it possible that the GPU is getting overloaded briefly when doing the temporal compression across multiple frames with images that look drastically different to the previous?
I’ve been simultaneously troubleshooting the texture problem mentioned in punnlert’s post so I haven’t had as much time as I would like to try and figure this issue out.
I’ve only been using ZEDExplorer to record SVO files since I wanted to eliminate my code being the problem. I don’t see a slider or option for enable image validity check in ZEDExplorer so I’m not sure if that is used by default in explorer or not.
You are right, enable_image_validity_check is an SDK InitParameters option and it is not exposed in ZED Explorer. It is disabled by default, so it is not involved in your recordings and you can exclude it from the investigation. Image enhancement is enabled by default, but its processing cost is negligible on an RTX 4070, so it is not a concern either.
Could this possibly be something to do with the SVO compression? I’m using H264 when recording. Is it possible that the GPU is getting overloaded briefly when doing the temporal compression across multiple frames with images that look drastically different to the previous?
Good reasoning, but this is not the cause. The ZED SDK uses the NVIDIA NVENC hardware encoder for H264/H265 SVO compression. NVENC is a dedicated silicon block, separate from the CUDA cores used by the SDK, so encoding does not compete with the rest of the processing. A sudden scene change increases the instantaneous bitrate and encoder effort, but a single 1080p@30 or 720p@60 stream uses only a small fraction of the NVENC capacity of your GPU, which can encode multiple 4K streams in real time. Your NVMe drive also easily absorbs the bitrate peaks, so disk I/O is not a bottleneck.
The few dropped frames you see during shade-to-sun transitions are explained by the auto exposure behavior. When the illumination changes abruptly, the AEC/AGC loop needs several frames to converge to the new exposure and gain values; in auto mode the exposure is increased before the gain, and in the darker phase of the transition the exposure time can approach the frame period at 60 fps, temporarily reducing the effective framerate. Losing 5 to 10 frames corresponds to roughly 100 to 160 ms of settling time, which is within normal operation and does not indicate a problem with your setup.
If this is an issue for your spatial mapping sessions, you can lock the exposure manually with setCameraSettings() when the lighting range of your environment allows it: Camera Controls | StereoLabs
One last suggestion: since the frame tearing disappeared after what was probably a background chipset/USB driver update, I recommend noting the current driver versions so you have a known-good baseline to restore if the issue ever reappears.